How to Use Music Analytics to Grow Your Independent Career
Learn how to read your music analytics, find your most engaged fan cities, target ads with demographic data and turn streaming stats into clear next steps.
By Sam Blackie, Head of Growth at un:hurd music
Last updated: 7 October 2026
Key Takeaways
- Spotify for Artists splits your audience into active listeners, who choose your music from your profile, your releases or their own library, and programmed listeners, who have only heard you through sources like editorial playlists, other people's playlists, Discover Weekly, Release Radar, Radio and Autoplay. Active listeners are the people to plan your marketing around.
- Your most engaged fan cities are the places where listeners save, follow and come back, which isn't always the city with your biggest listener count.
- Streams per listener, saves and listener-to-follower conversion show whether a song is gaining traction beyond its first discovery.
- Age, gender and location data from Spotify for Artists and Instagram tell you who to target with social ads, so your budget reaches people who look like the fans you already have.
- un:hurd's Smart Insights reads your streaming and social data together and tells you the next move in plain language. For Katya, that meant a London show once her fan count there passed 500.
Music analytics help you grow when you read each number against a decision: which listeners to keep, which cities to focus on, who to target with ads and what to do next. The free dashboards (Spotify for Artists, Apple Music for Artists and YouTube Analytics for Artists) already give you most of what you need. The skill is knowing which handful of numbers to check and what each one should change.
Most artists already have this data and rarely act on it. As un:hurd founder Alex Brees puts it, "The biggest mistake is artists don't know what to do with their data or what they are looking for. So it causes confusion and people end up not doing anything in fear of making the wrong choice."
The difference between passive streams and active fans
Passive streams come from listeners who hear your music without looking for it, through editorial playlists, other people's playlists, Discover Weekly, Release Radar, Radio, Autoplay or Spotify's AI DJ. Active engagement comes from listeners who seek you out on purpose, by opening your artist profile, playing a release page or streaming you from their own library and playlists.
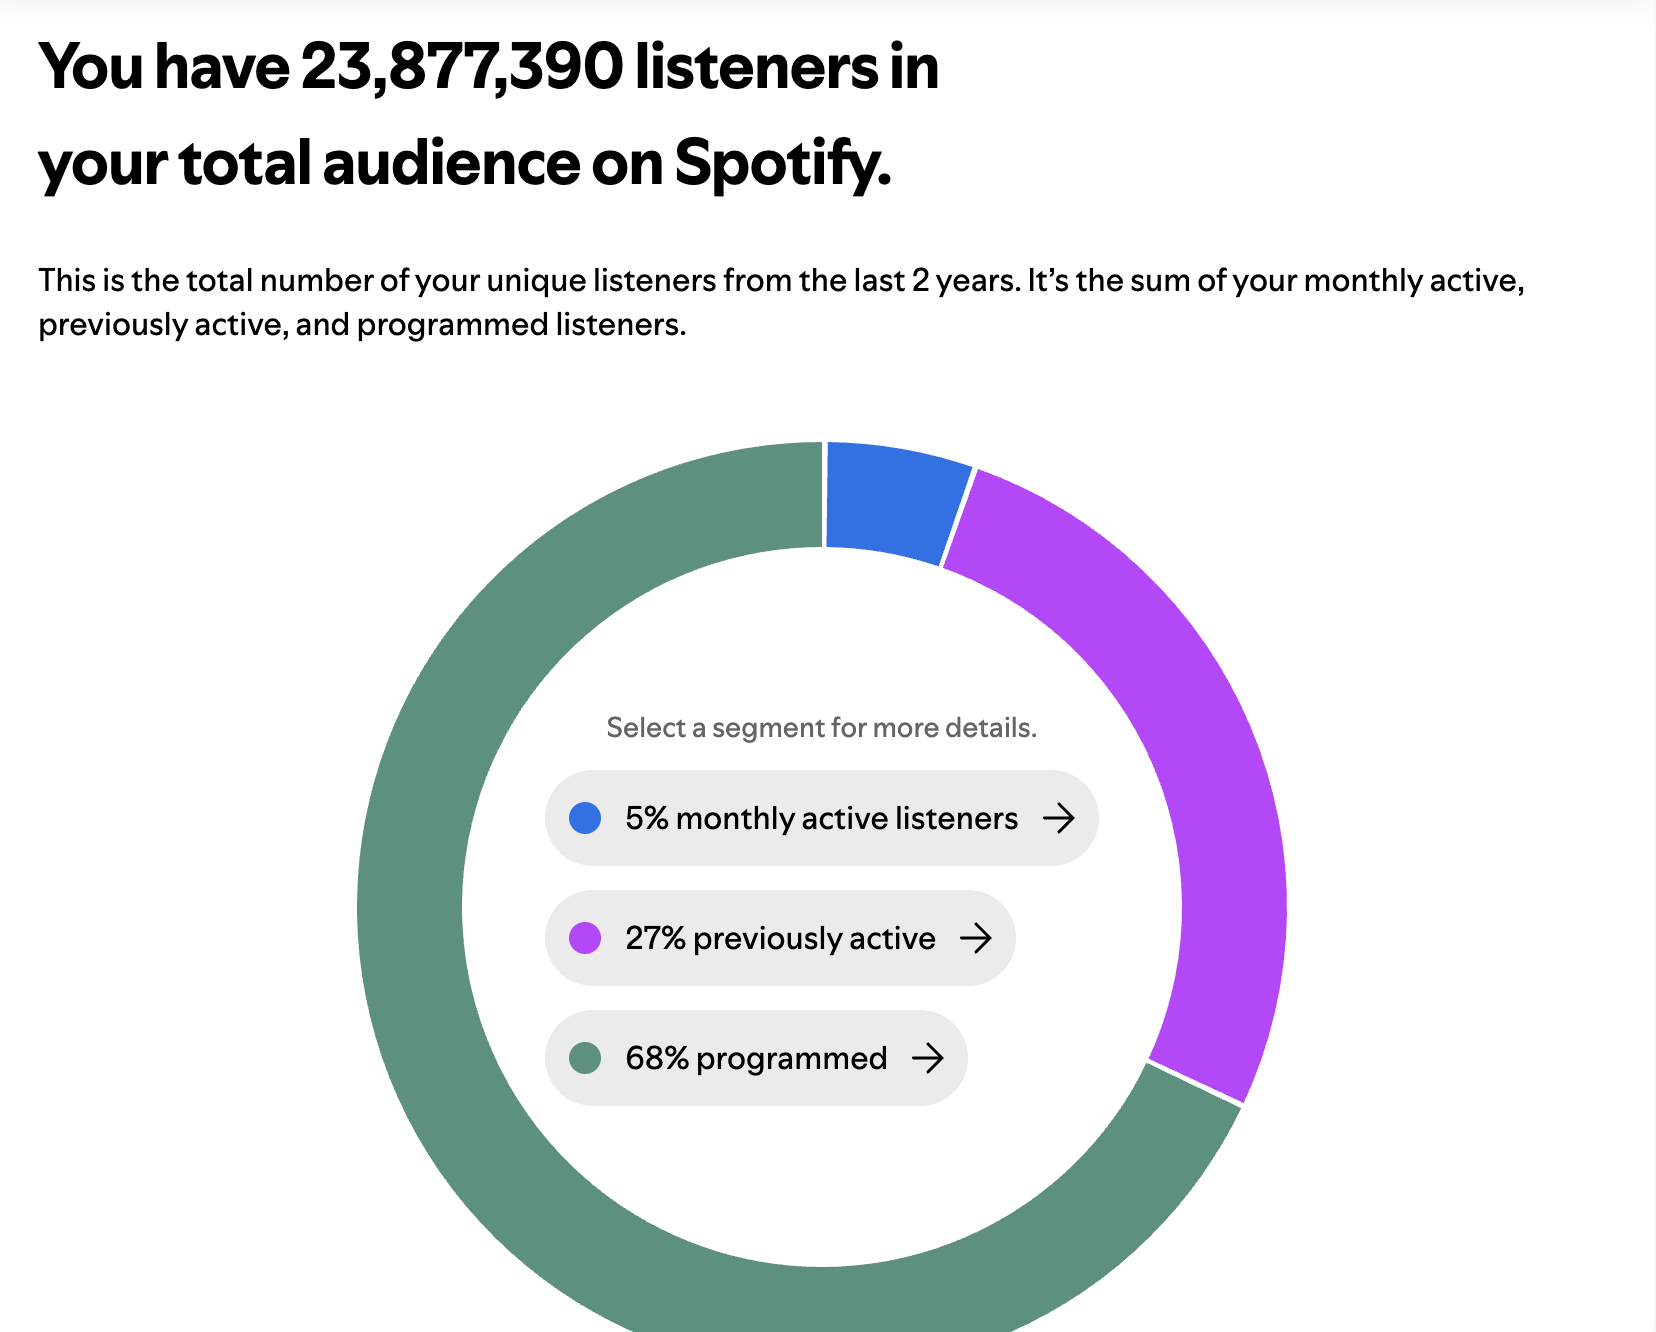
Spotify for Artists shows this split under Audience, then Segments. Spotify groups your total audience (every unique listener from the past two years) into these segments:
Monthly active listeners
People who streamed you from an active source in the last 28 days. Spotify breaks them down further into super listeners (15 or more intentional streams in 28 days), moderate listeners (3 to 14) and light listeners (1 or 2).
Previously active listeners
People who used to stream you on purpose but haven't in the last 28 days. They've already shown interest, so they're easier to win back.
Programmed listeners
People who have only heard you through programmed sources (editorial playlists, other people's playlists, Discover Weekly, Release Radar, Radio, Autoplay and AI DJ) and haven't streamed you from an active source in at least two years.
Active listening is worth chasing. Spotify says that, on average, listeners who actively stream a song play that artist 4x more over the next six months. So a big monthly listener number built mostly on programmed listening can disappear as soon as a playlist drops you.
The Segments tab also shows listener conversion over the last 28 days: new listeners, new active listeners and reactivated listeners. If new active listeners climb after a release, your music is turning casual listeners into fans. If programmed listeners grow and active listeners don't, you're getting reach without getting fans.
How to find your most engaged fan cities
Your most engaged fan cities are the ones where listeners act on what they hear, by saving, following and coming back. To find them, compare your top cities by listener count with your engagement in those places, and with your social following in the same cities.
Start with the top cities list in Spotify for Artists, then open your Instagram insights and check the top cities there too. Spotify for Artists only shows locations for the last 28 days, so you can't scroll back to see a city growing. Write your top five cities down each month (the data check below covers this) and you'll have the history Spotify doesn't keep. A city that appears near the top of both lists is a stronger market than a city that only shows up on Spotify, because people there follow you as an artist as well as playing your songs.
Watch for cities that are growing faster than your overall audience. A sudden jump in one place usually has a cause, such as a local playlist, a radio play, a creator using your track or a gig. Find out what it was, because that's the thing to repeat.
In un:hurd, Smart Insights counts your fans per city across all your connected platforms and flags when a city passes a milestone, which is how Katya's London audience got flagged.
Why demographic data matters for your ads
Demographic data matters for social ads because Meta and TikTok let you target by age, gender, location and interests. Your streaming and social data tell you which of those settings describe the people who already like your music. Without that data you're guessing, and a guess spends money on people who were never likely to become fans.
Spotify for Artists gives you engagement and demographic insights (age, gender and location) for your listeners and followers, covering the last 28 days. Instagram insights add the same for your followers. If both point the same way (say, mostly 18 to 24, concentrated in Manchester and Leeds), that's your starting audience for a campaign.
Interests are the harder part to work out yourself. Meta lets you target interests in many well-known artists, so the names in the "Fans also like" section of your Spotify profile are a sensible place to start. Add them on top of location and age, then check after a week which ad sets bring in the cheapest followers or streams.
If you'd rather not set up an ad account at all, un:hurd's social ad tool builds and runs campaigns for you on Spotify, Meta, TikTok and YouTube. You can keep the targeting simple, or get specific with the ages, locations and interests your data points to.
The numbers that show a song is gaining traction
A song is gaining traction beyond its first discovery when listeners come back to it, save it, go looking for more of your music and follow you afterwards. Follower growth and new active listeners in the weeks after a release are two of the clearest signs that a song is turning listeners into fans, and Instagram profile visits show whether that interest is spilling over to your socials. Stream count on its own can't tell you that, because one playlist add can make streams spike without anyone remembering your name.
Streams per listener
Streams per listener is your total streams divided by your listeners over the same period. It shows how often the average listener plays you. A rising number means people are replaying your music. A falling number usually means you've reached new, more casual listeners who haven't come back yet.
As an example, one un:hurd artist's dashboard currently shows 2.8 streams per listener, down 2.5%. That's worth reading alongside listener growth. If listeners went up in the same period, the dip probably just reflects new people arriving. If listeners didn't go up, repeat listening is fading and it's time to give existing fans a reason to come back.
Saves and listener-to-follower conversion
Saves show that a listener wants a song in their library, which puts it back in front of them later. Spotify for Artists shows saves for each song, so compare saves with listeners for the same track. The songs with the highest share of saves are the ones to promote next.
Listener-to-follower conversion is your Spotify followers divided by your monthly listeners. Followers are an all-time total and monthly listeners only cover the last 28 days, so artists with a big back catalogue can go over 100%. What matters is the direction it moves after each release.
Spotify says listeners are, on average, 3x more likely to stream an artist over the next six months after following them. New releases land in followers' What's New feed as soon as they're live, and followers are among the people Release Radar serves (it also reaches non-followers, gives each listener one song per artist per week, and needs your music delivered at least 7 days before release to make the first week). So this number matters for every release that comes after. It's also one of the signals people link to your Spotify popularity score, and our guide to the Spotify Popularity Index explains what affects that score.
Which playlists are bringing you fans
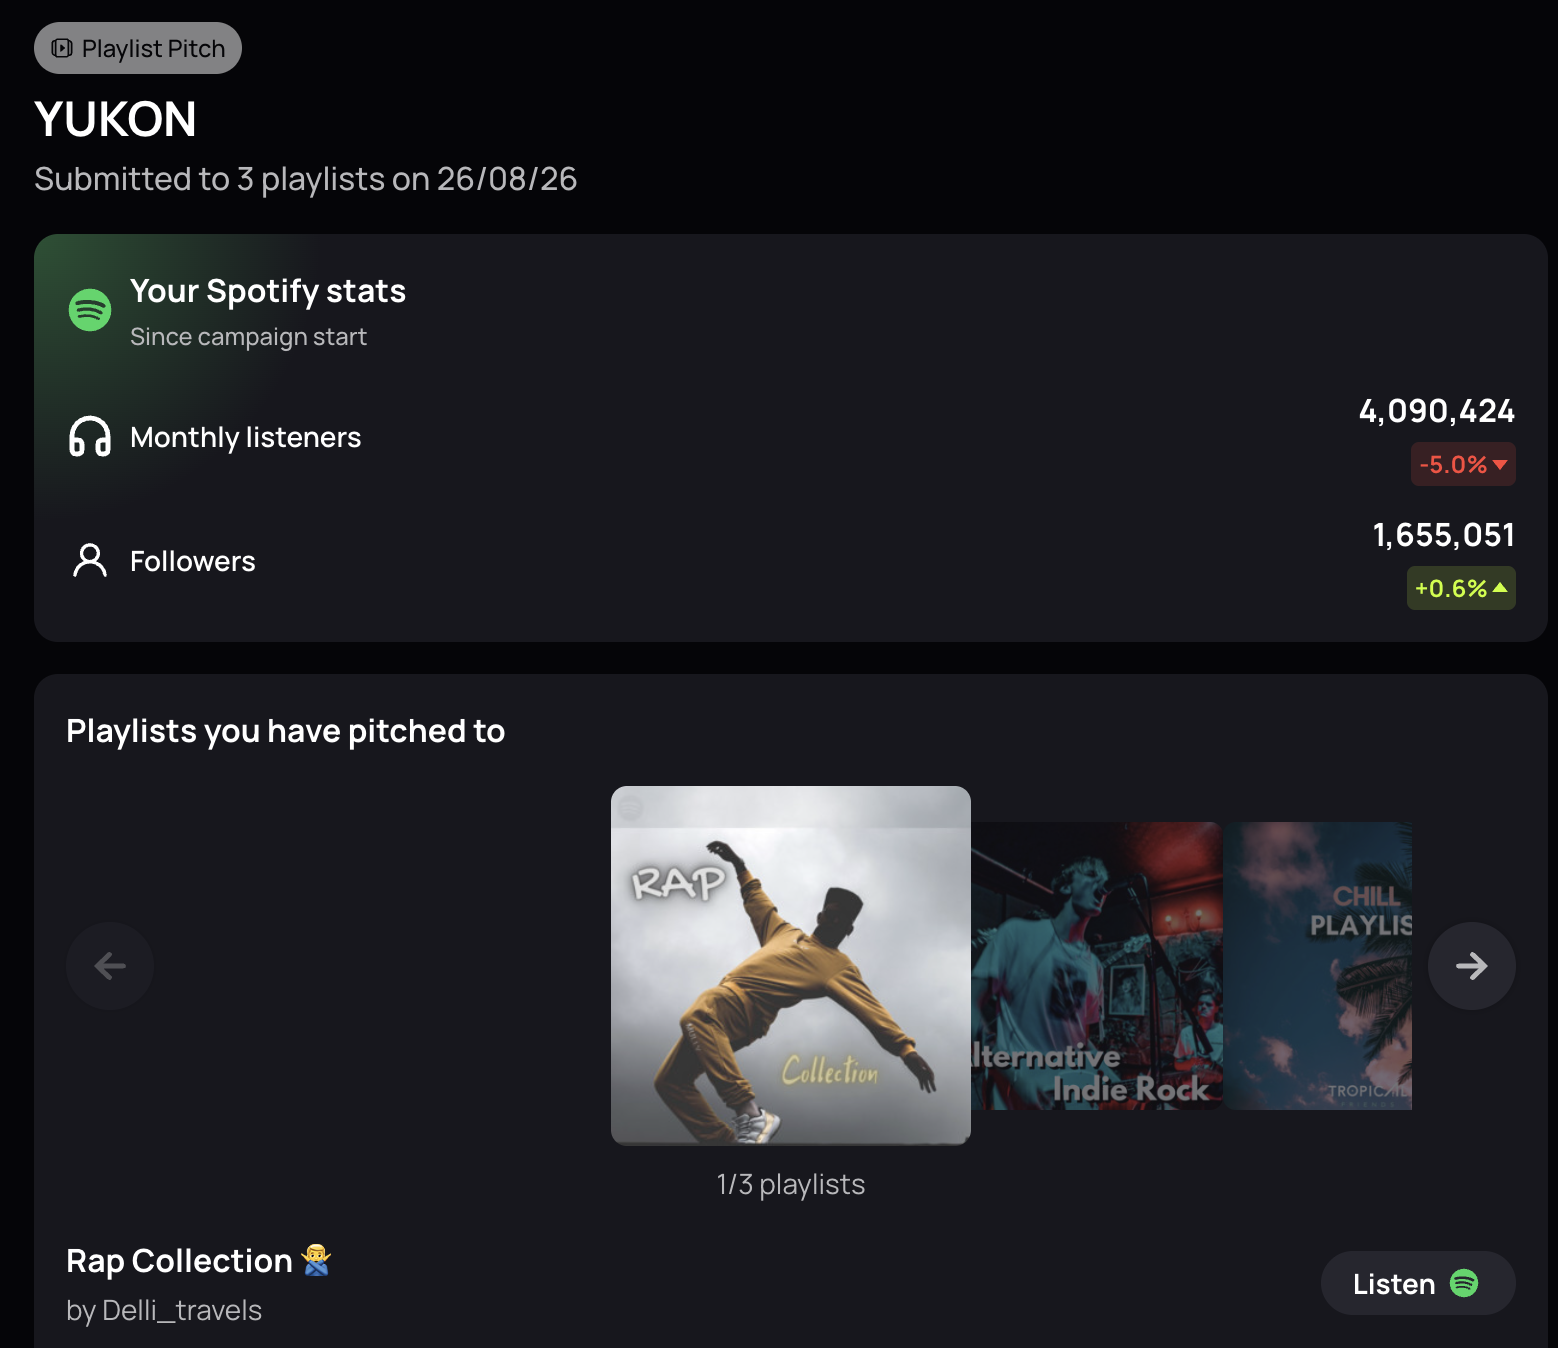
A playlist is driving new fans if your followers and active listeners rise after you're added, and not just your streams. Spotify for Artists lists the playlists your songs are on and the streams from each. Check what happens to followers and to the Segments tab in the weeks after a big add.
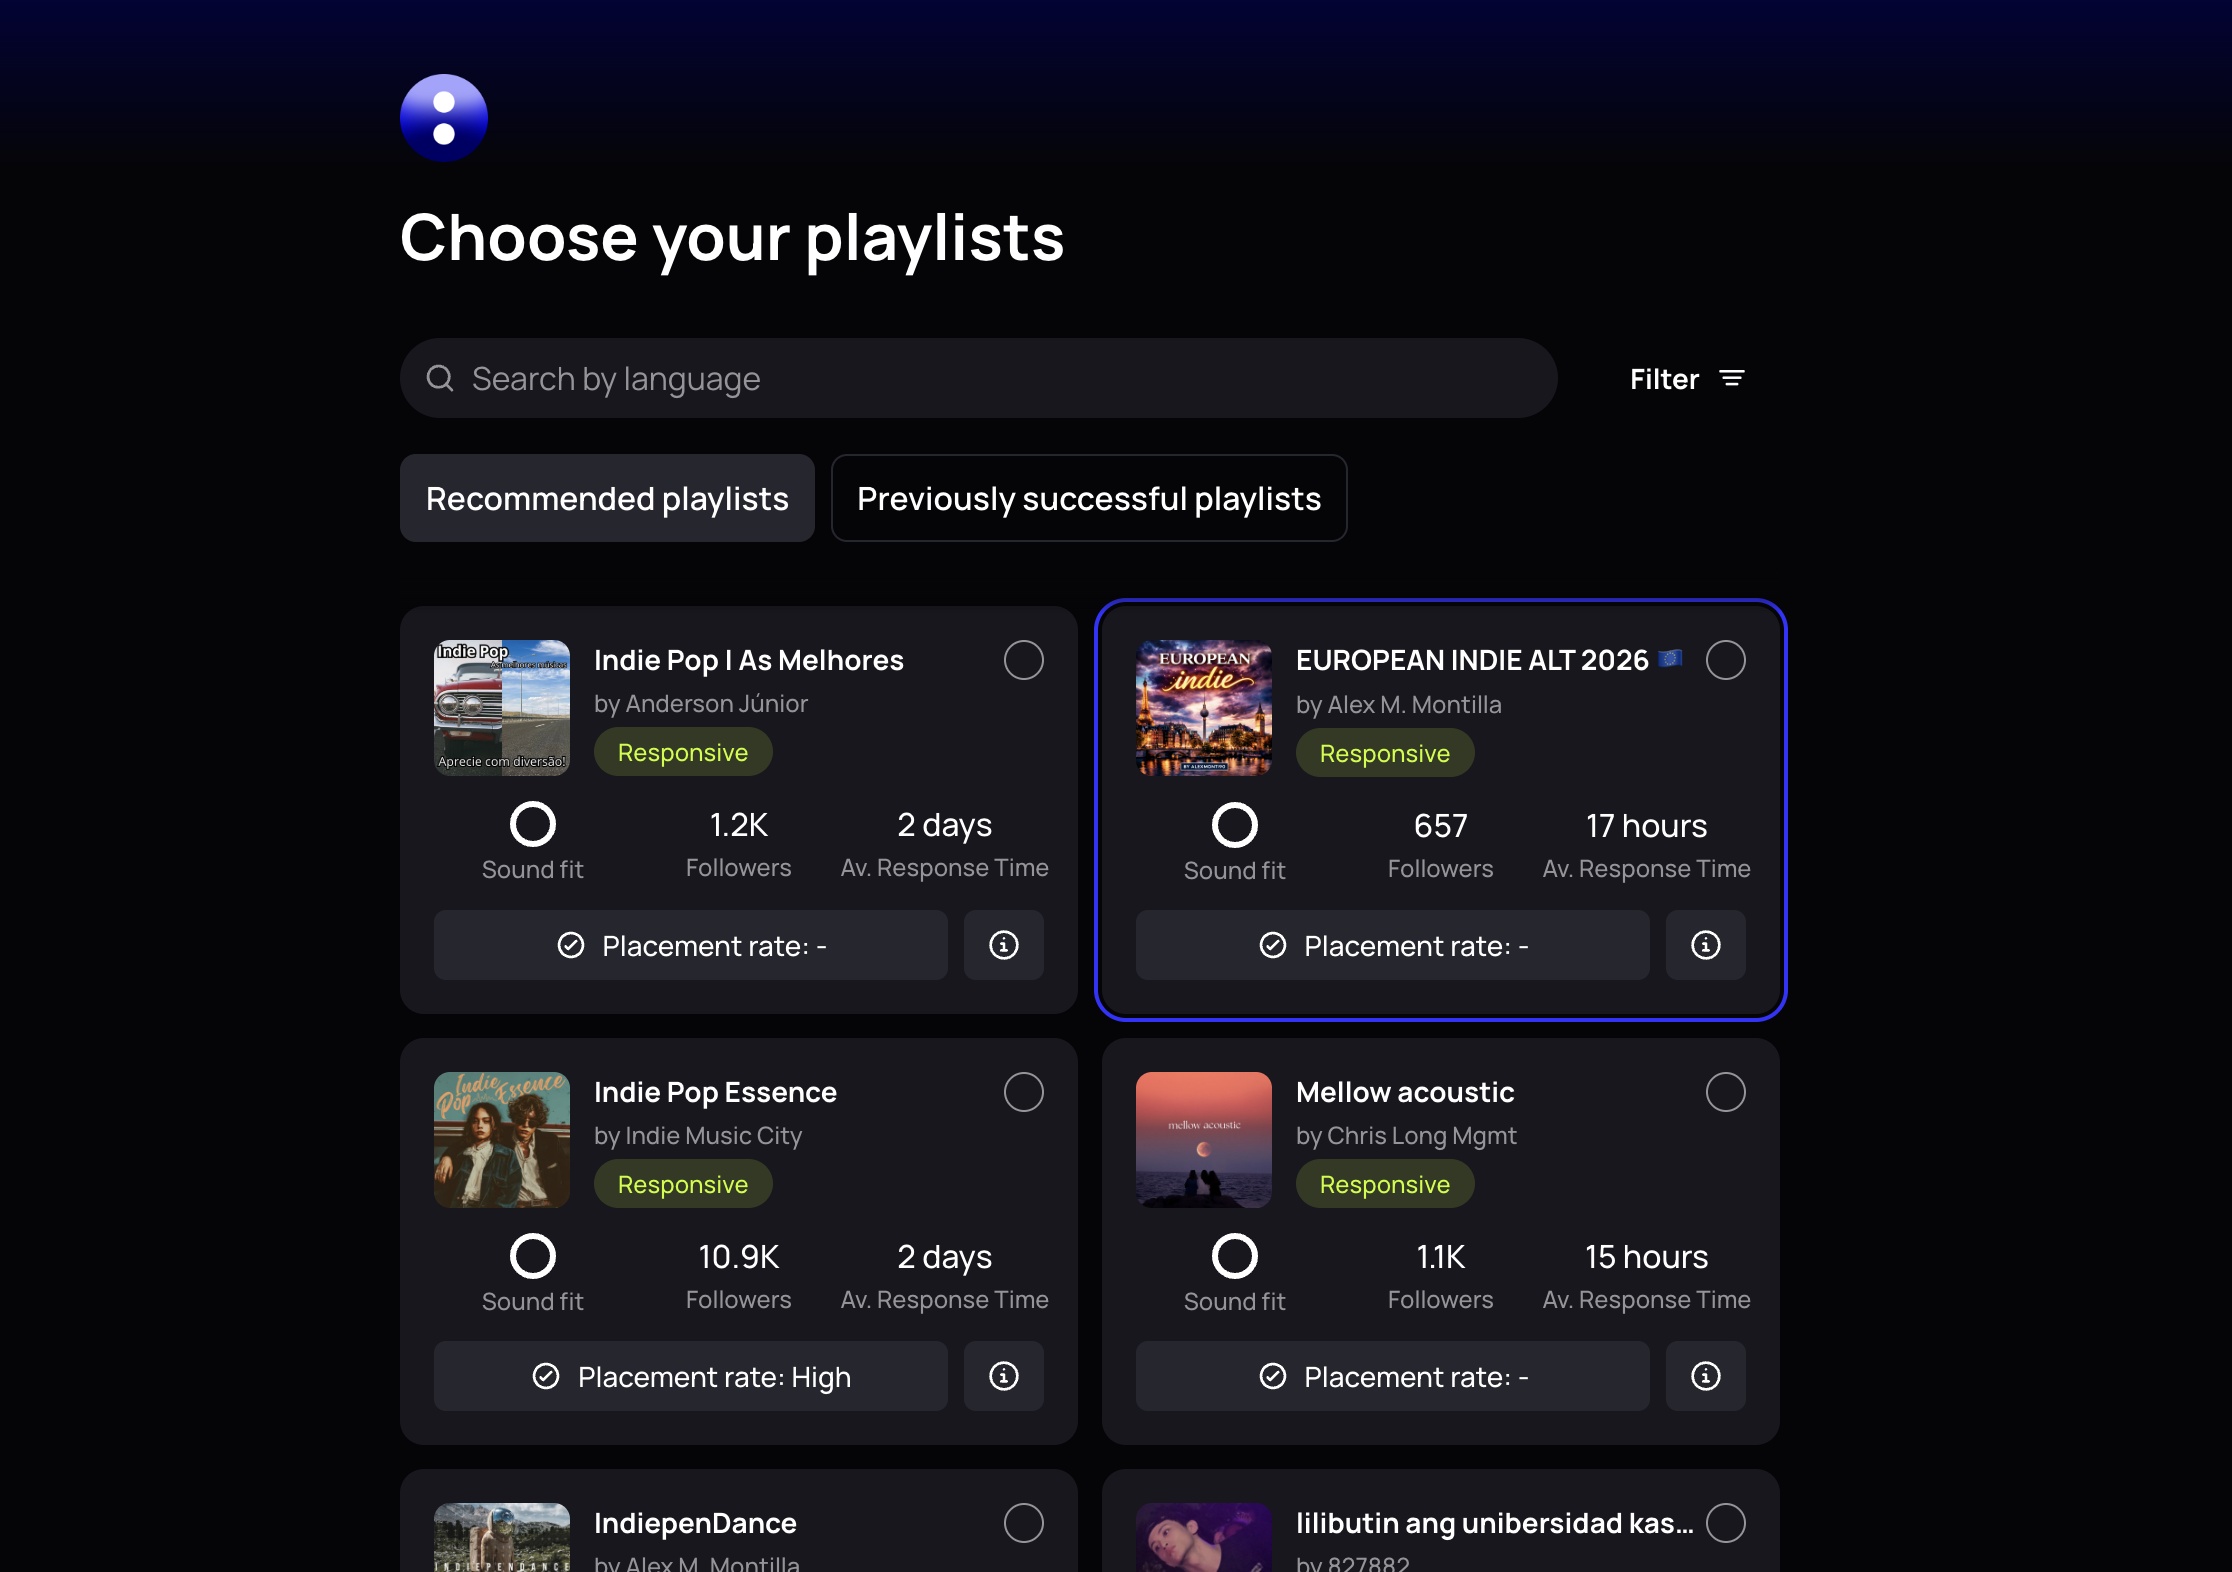
un:hurd's playlist pitching shows this for every campaign. Each pitch has its own stats screen showing how your Spotify monthly listeners and followers change over the four weeks after the campaign starts. That makes it easy to see which placements brought you followers and which only brought you plays.
Declines are part of it for everyone. When we pitched Justin Bieber's "YUKON" as an example campaign, curators declined it too. So judge each campaign on what the four-week stats show.
Steer clear of anyone selling guaranteed placements or paid adds. Those playlists tend to fill up with listeners (or bots) who never come back, and services selling guaranteed streams or placements break Spotify's terms. When Spotify confirms artificial streaming, it can withhold royalties, correct your public counts, adjust charts, pull your tracks from Spotify playlists and remove your music, and it charges distributors per track in flagrant cases. Before you pitch, our guide on how to evaluate Spotify playlist quality shows you what to check.
How to turn your music analytics into next steps
To turn music analytics into next steps, match each signal to one action, give the action a date and check the same number again afterwards. A rising city becomes a gig or a local ad campaign. A song with strong saves becomes your next focus track. A playlist that converted becomes a model for your next pitch.
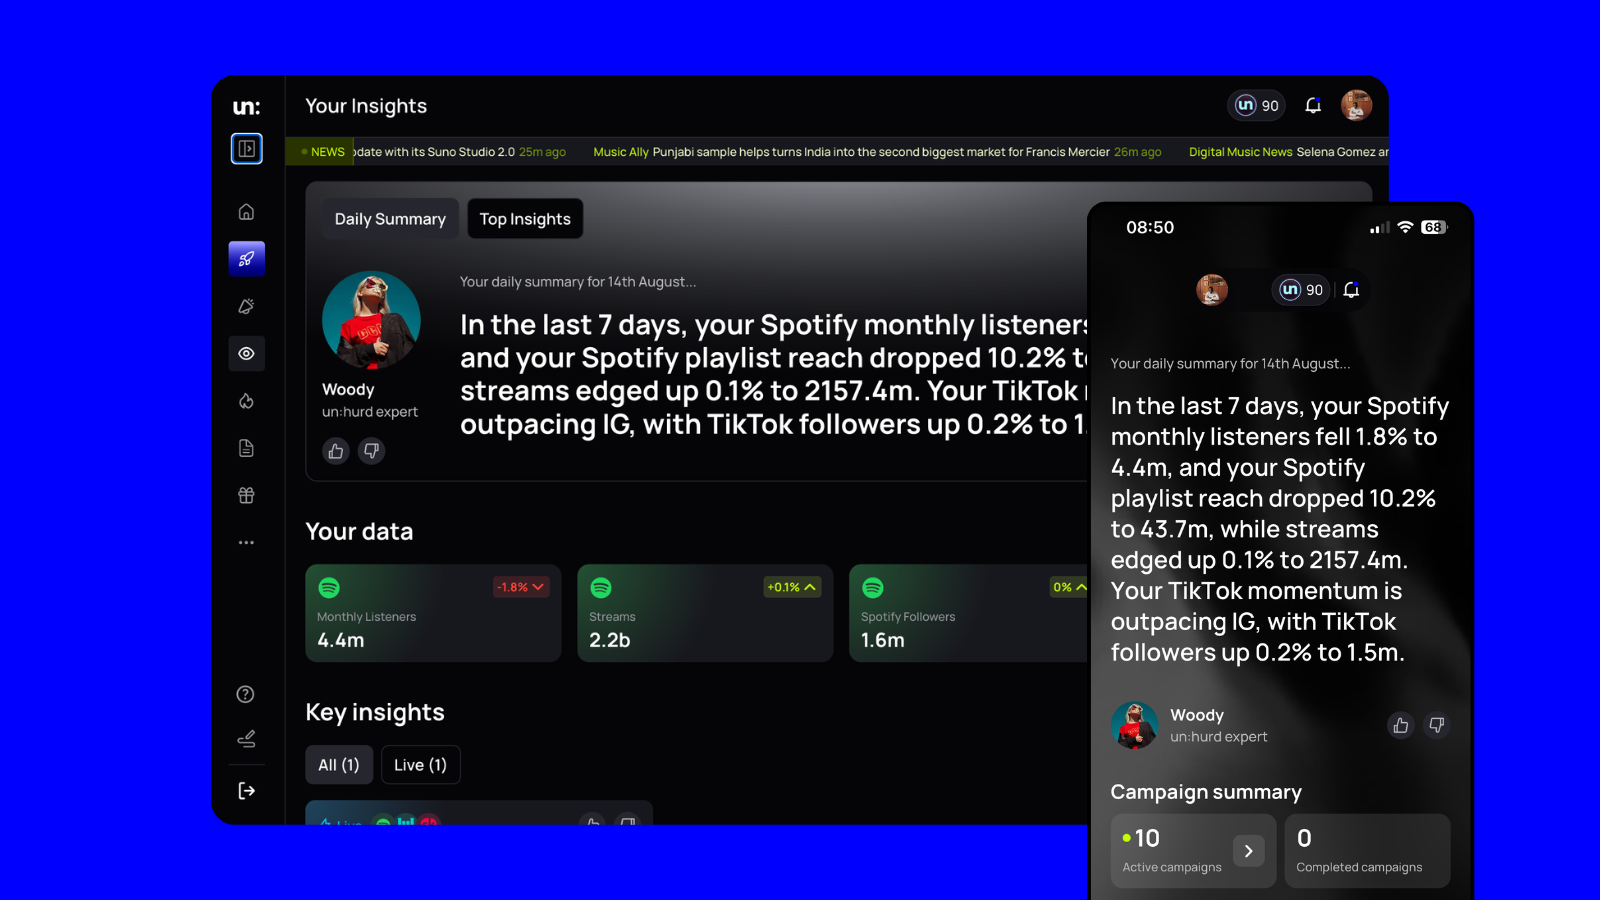
Doing that by hand means checking Spotify for Artists, Instagram and YouTube separately, then working out what they mean together. Smart Insights in un:hurd does that step for you. It reads the data behind your streams, socials and releases and hands you the next move in plain language. Your daily summary on the app's home screen pulls it together each morning.
How Katya went from 500 London fans to the Roundhouse
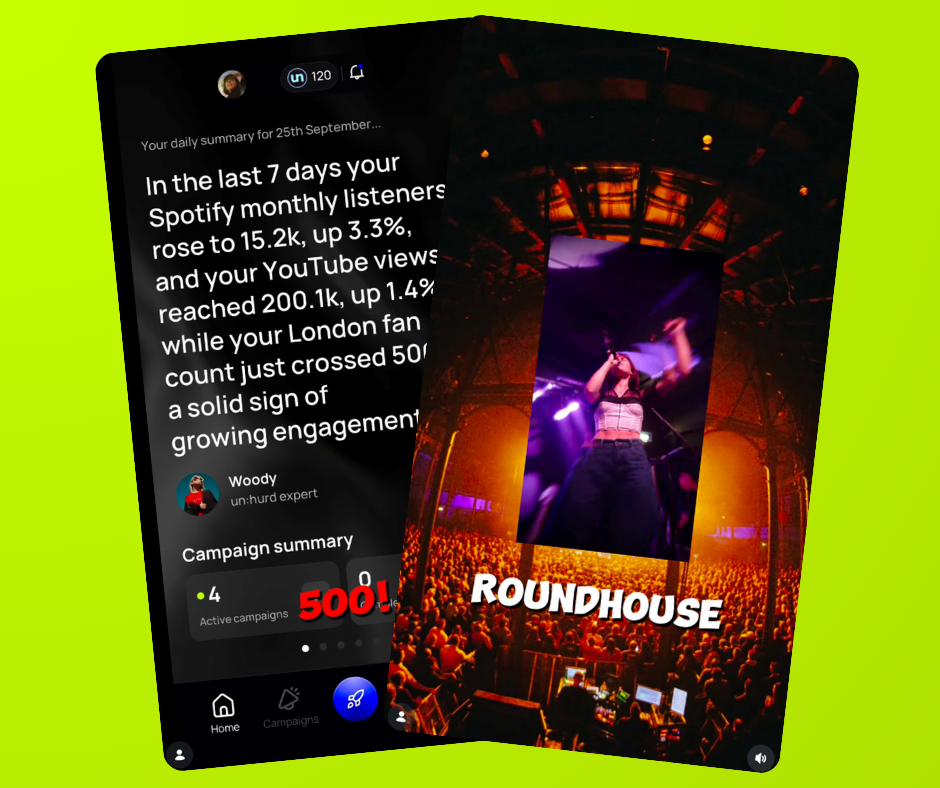
Katya's un:hurd daily summary on 25 September 2026 showed her Spotify monthly listeners had risen to 15.2k over the previous seven days, up 3.3%. Her YouTube views had reached 200.1k, up 1.4%, and her London fan count across her connected platforms had just crossed 500.
Insights flagged that London milestone and recommended she plan a live show there. She's now supporting Parra For Cuva at London's Roundhouse on 17 October 2026, and she's using a Live Planning Cycle in un:hurd to build awareness of the show. Planning Cycles give you a marketing plan shaped around your time and your goal, whether that's a release, live shows, content or the business side, and they walk you through each task in order.
You can follow Katya on Instagram at @katyatheartist.
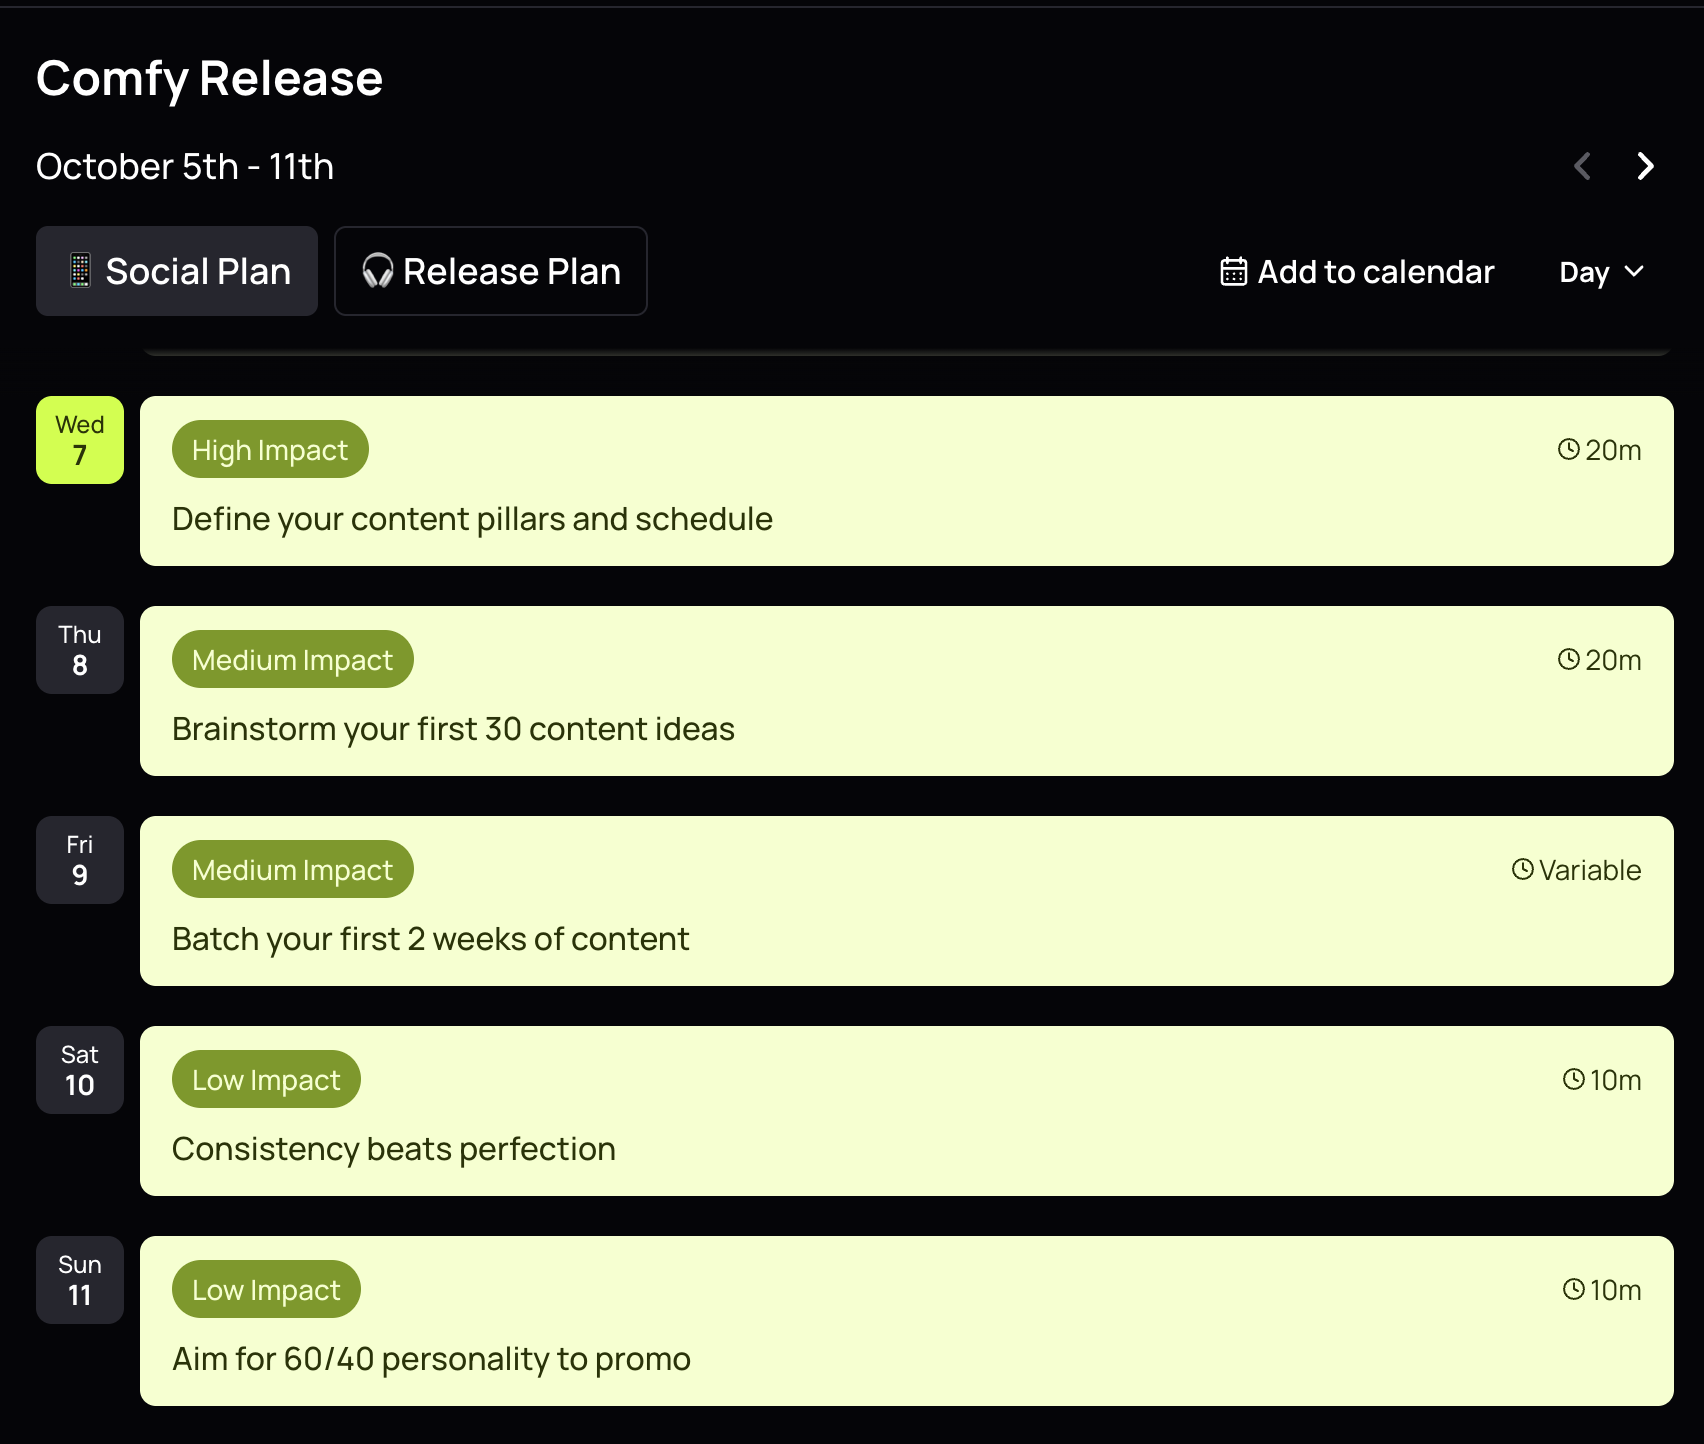
A monthly 20-minute data check
Whether or not you use un:hurd, set a recurring 20 minutes once a month and note five numbers in a spreadsheet: monthly active listeners, new active listeners, streams per listener, listener-to-follower conversion and your top five cities. Add one line on what you released or promoted that month. Most of these figures only cover a rolling 28 days in Spotify for Artists (and city data disappears after that), so your spreadsheet becomes the only record of how they've changed.
After three or four months you'll see which activity moved which number, and that's what you base the next plan on. It's far more useful than checking every day during a release, when the numbers change too often to tell you anything.
The short version
Spotify for Artists' Segments tab shows how much of your audience is listening on purpose, and active listeners are the ones to grow. Your best cities are where people save, follow and return, so compare streaming and social data before you spend on ads or book a gig. Streams per listener, saves, follower conversion and what happens after a playlist add tell you whether a song is building fans or just collecting plays. Then give every signal one action and a date, and check the number again afterwards.
Get your next move from your own data
Connect your Spotify and Instagram to un:hurd, and Smart Insights will show you which cities and songs to act on first. When it flags a move, like Katya's London show, start a Planning Cycle to turn it into a plan. Membership is £12.99 a month with one £6 playlist pitch included each month, or £69.99 a year with 12 pitches included (worth £72).
If you're comparing tools first, our breakdown of music analytics tools for independent artists covers the free and paid options.
About the author
Sam Blackie is Head of Growth at un:hurd music, where he works on how independent artists find, use and act on their data across the un:hurd app.