How to Tell If Your Fanbase Is Actually Growing: Turning Streaming Data Into Growth
Learn which streaming numbers show real fan growth, how to read Spotify for Artists audience segments and how to turn your data into your next release plan.

By Sam Blackie, Head of Growth at un:hurd music
Last updated: 8 October 2026
Key Takeaways
- Your fanbase is growing when more people play you on purpose and keep coming back. In Spotify for Artists, check that monthly active listeners are rising and that more of them sit in the super (15 or more intentional streams in 28 days) and moderate (3 to 14) segments.
- Monthly listeners counts everyone who heard you in the last 28 days, including people who only heard you on someone else's playlist, Radio or Autoplay. Monthly active listeners only counts people who chose to play you, which makes it the better measure of fans.
- Follows and active streams predict future listening. Spotify says listeners are 3 times more likely to stream an artist in the next 6 months after following them, and listeners who actively stream a song play that artist 4 times more over the next 6 months.
- Among about 74 un:hurd artists who used Planning Cycles in the last 30 days and completed at least five tasks, 81% grew their Spotify monthly listeners, followers or Popularity score month on month. Artists above 1,000 monthly listeners were far more likely to grow their listeners than artists under 10.
To tell if your fanbase is actually growing, look past total streams and monthly listeners to the people who choose to play you. The Segments tab in Spotify for Artists splits your audience by how intentionally they listen, so you can see whether people are moving from hearing a song once to coming back for more. Real fan growth shows up as rising monthly active listeners, more super and moderate listeners, a steady flow of new and reactivated listeners, and followers and saves that keep climbing.
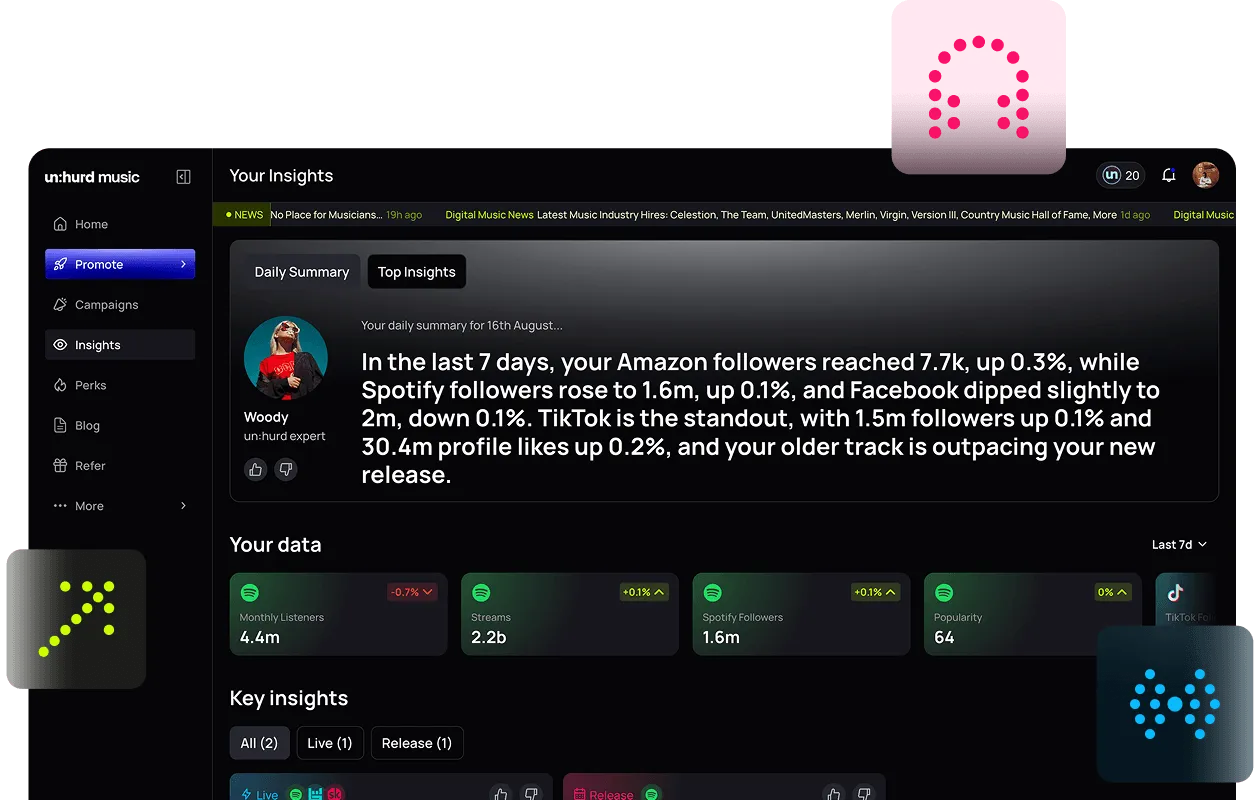
un:hurd's Smart Insights and daily summary have replaced the benchmark graph and combined fanbase view this page used to describe, so the sections below cover what to read in Spotify for Artists and how un:hurd turns it into your next move.
Monthly listeners vs monthly active listeners
Monthly listeners is everyone who streamed you in the last 28 days. Monthly active listeners is the part of that audience who chose to play you, from your artist profile, your release pages, or their own library and playlists.
The gap between the two comes from programmed listening. Spotify counts editorial playlists, other listeners' playlists, Discover Weekly, Release Radar, Radio, Autoplay and AI DJ as programmed sources. A big playlist add can push your monthly listeners up quickly while barely changing how many people know your name.
Spotify for Artists groups everyone who has heard you in the last two years into three segments:
- Monthly active listeners have intentionally streamed you in the last 28 days.
- Previously active listeners used to be active but haven't intentionally streamed you for at least 28 days. They may still hear you through programmed sources.
- Programmed listeners have only heard you through programmed sources, with no active plays in at least 2 years.
Both monthly numbers run on a rolling 28-day window, so they rise and fall with your release schedule. Compare like with like, such as the four weeks after this release against the four weeks after your last one.
The fan growth indicators to watch in Spotify for Artists
The clearest sign of a growing fanbase is your active listeners playing you more often over time. Spotify splits monthly active listeners by how many times they intentionally streamed you in the last 28 days:
- Super listeners: 15 or more intentional streams
- Moderate listeners: 3 to 14 intentional streams
- Light listeners: 1 or 2 intentional streams
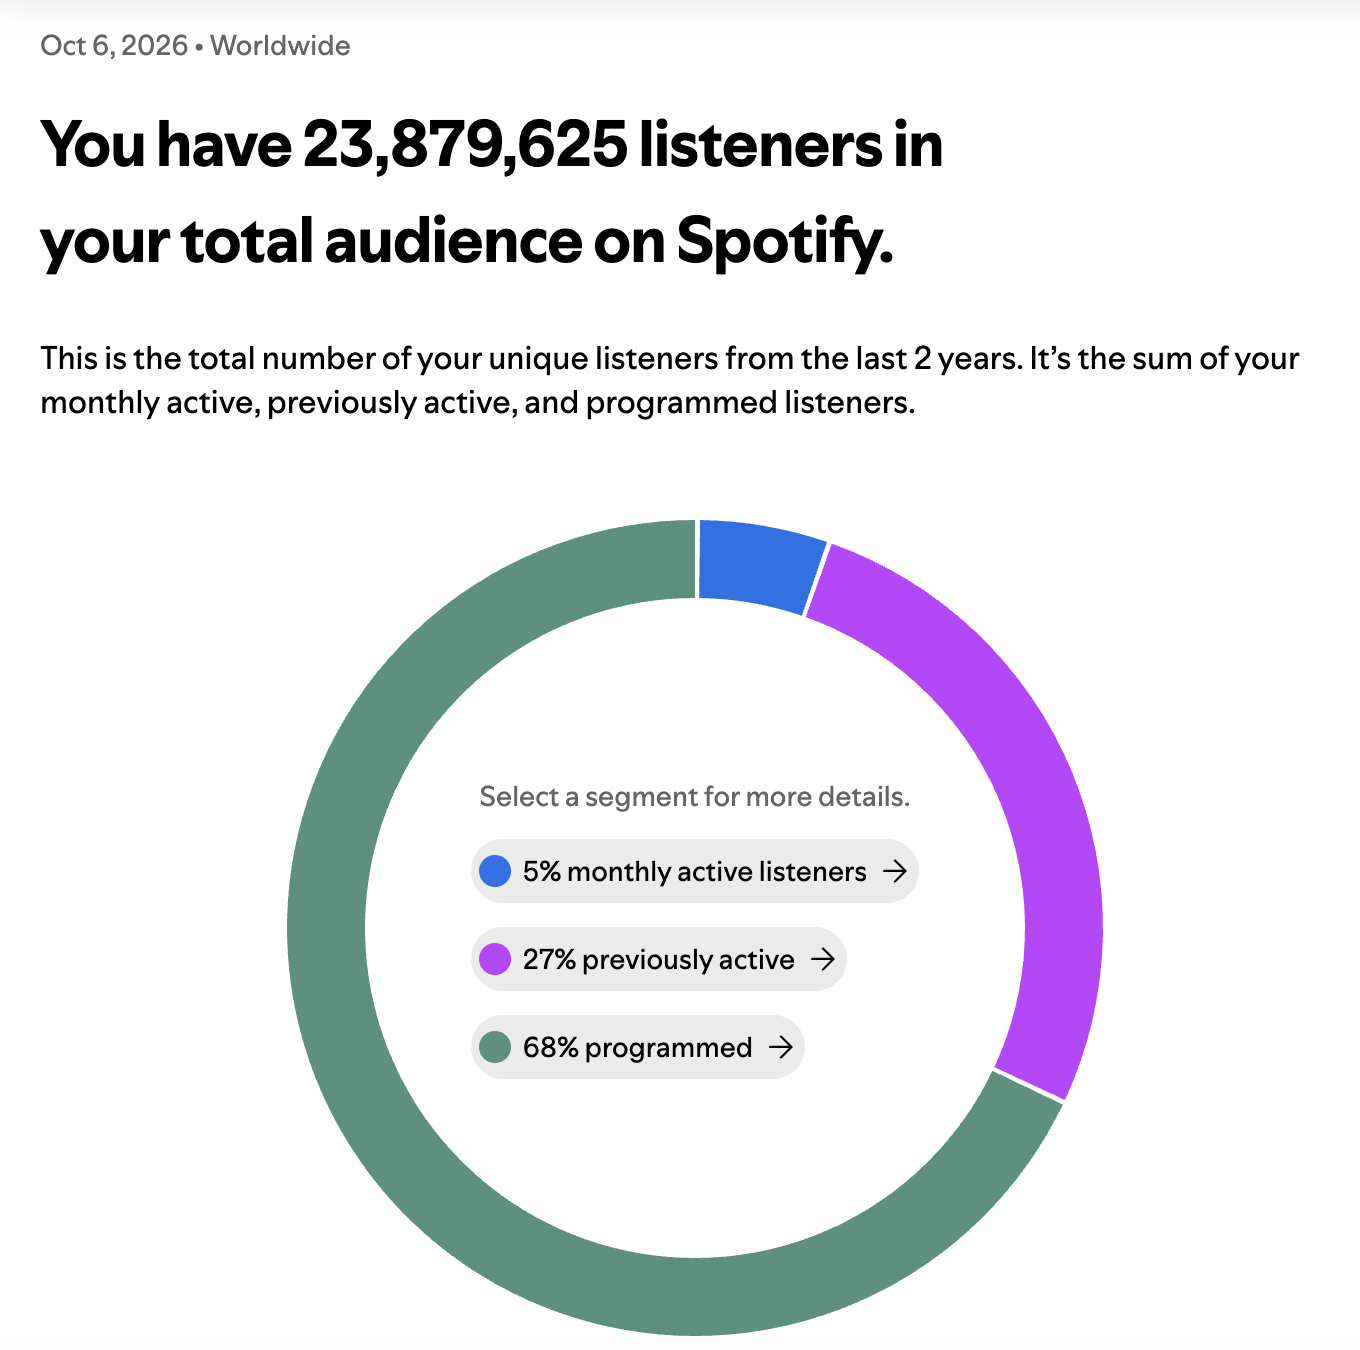
If your super and moderate groups grow from one month to the next, people are coming back. If light listeners grow and the other two stay still, you're reaching new people who haven't stuck yet.
Spotify also shows how people joined your active audience over the last 28 days. New listeners hadn't streamed you anywhere in 2 years, new active listeners hadn't been monthly active in 2 years, and reactivated listeners were previously active and have come back. Reactivated listeners rising after a release is a good sign your older fans are still paying attention.
Followers and saves move more slowly, and they pay off later. Spotify says listeners are 3 times more likely to stream an artist in the next 6 months after following them, and listeners who actively stream a song play that artist 4 times more over the next 6 months. Your follower count is an all-time total, so it rarely goes down. To see how well you turn listening into follows, divide followers by monthly listeners. The result can go over 100% because followers count across all time and monthly listeners only covers 28 days.
If you're comparing tools that track these numbers across platforms, our roundup of the best Spotify analytics tools for independent artists covers the main options.
What un:hurd artists' numbers show about fan growth
We looked at about 74 un:hurd artists who had used Planning Cycles in the last 30 days and completed at least five tasks. 81% of them grew at least one of their Spotify monthly listeners, followers or Popularity score month on month, and 77% of the 26 artists we had stream counts for grew their Spotify streams.
Spotify followers grew for 68% of the group, and only four artists lost followers. That makes followers the steadiest of the three, so read follower growth alongside your active listeners rather than on its own.
Monthly listeners swung the most, because the number runs on a rolling 28 days and moves with release timing. Nearly half of the group saw monthly listeners drop, while the artists who grew them grew a lot, with a median rise of 68%.
Audience size made a big difference. Monthly listeners grew for 67% of artists above 1,000 monthly listeners, compared with 17% of artists under 10. If you're starting from a very small audience, judge your progress on followers, saves and active listeners for a while, because one quiet month can knock a 28-day listener count back.
Spotify's Popularity score was the stat least likely to move. Of the 40 artists in the group whose score stayed flat, 29 were sitting at 0. Spotify needs a decent level of recent streams before the score moves at all, so a flat Popularity score early on is a floor to get over and says little about how your fans feel.
What to check in the week your song comes out
In launch week, watch who is choosing your new song and how often, more than the total stream count. Spotify for Artists gives you four useful views:
- The live stream count is available for the first 7 days of a new release and updates every 2 seconds.
- Release engagement shows how many monthly active listeners streamed your new music each day for the first 28 days after release.
- Saves go up each time someone taps the plus button to add the song to their library.
- Source of streams splits plays into active and programmed sources, and you can filter it by streams, listeners or streams per listener.
Stats refresh once a day at around 8pm UTC, and Spotify counts days in UTC. A song released late in the evening UK time can show nothing for release day, so give it until the next refresh before you worry.
If release engagement holds up after the first few days and saves keep coming in, people are returning to the song. If nearly all your streams come from programmed sources, the song is being heard, and your next job is giving those listeners a reason to look you up. Our guide to music analytics for independent artists covers fan cities and demographics if you want to go further.
How to measure playlist performance beyond stream counts
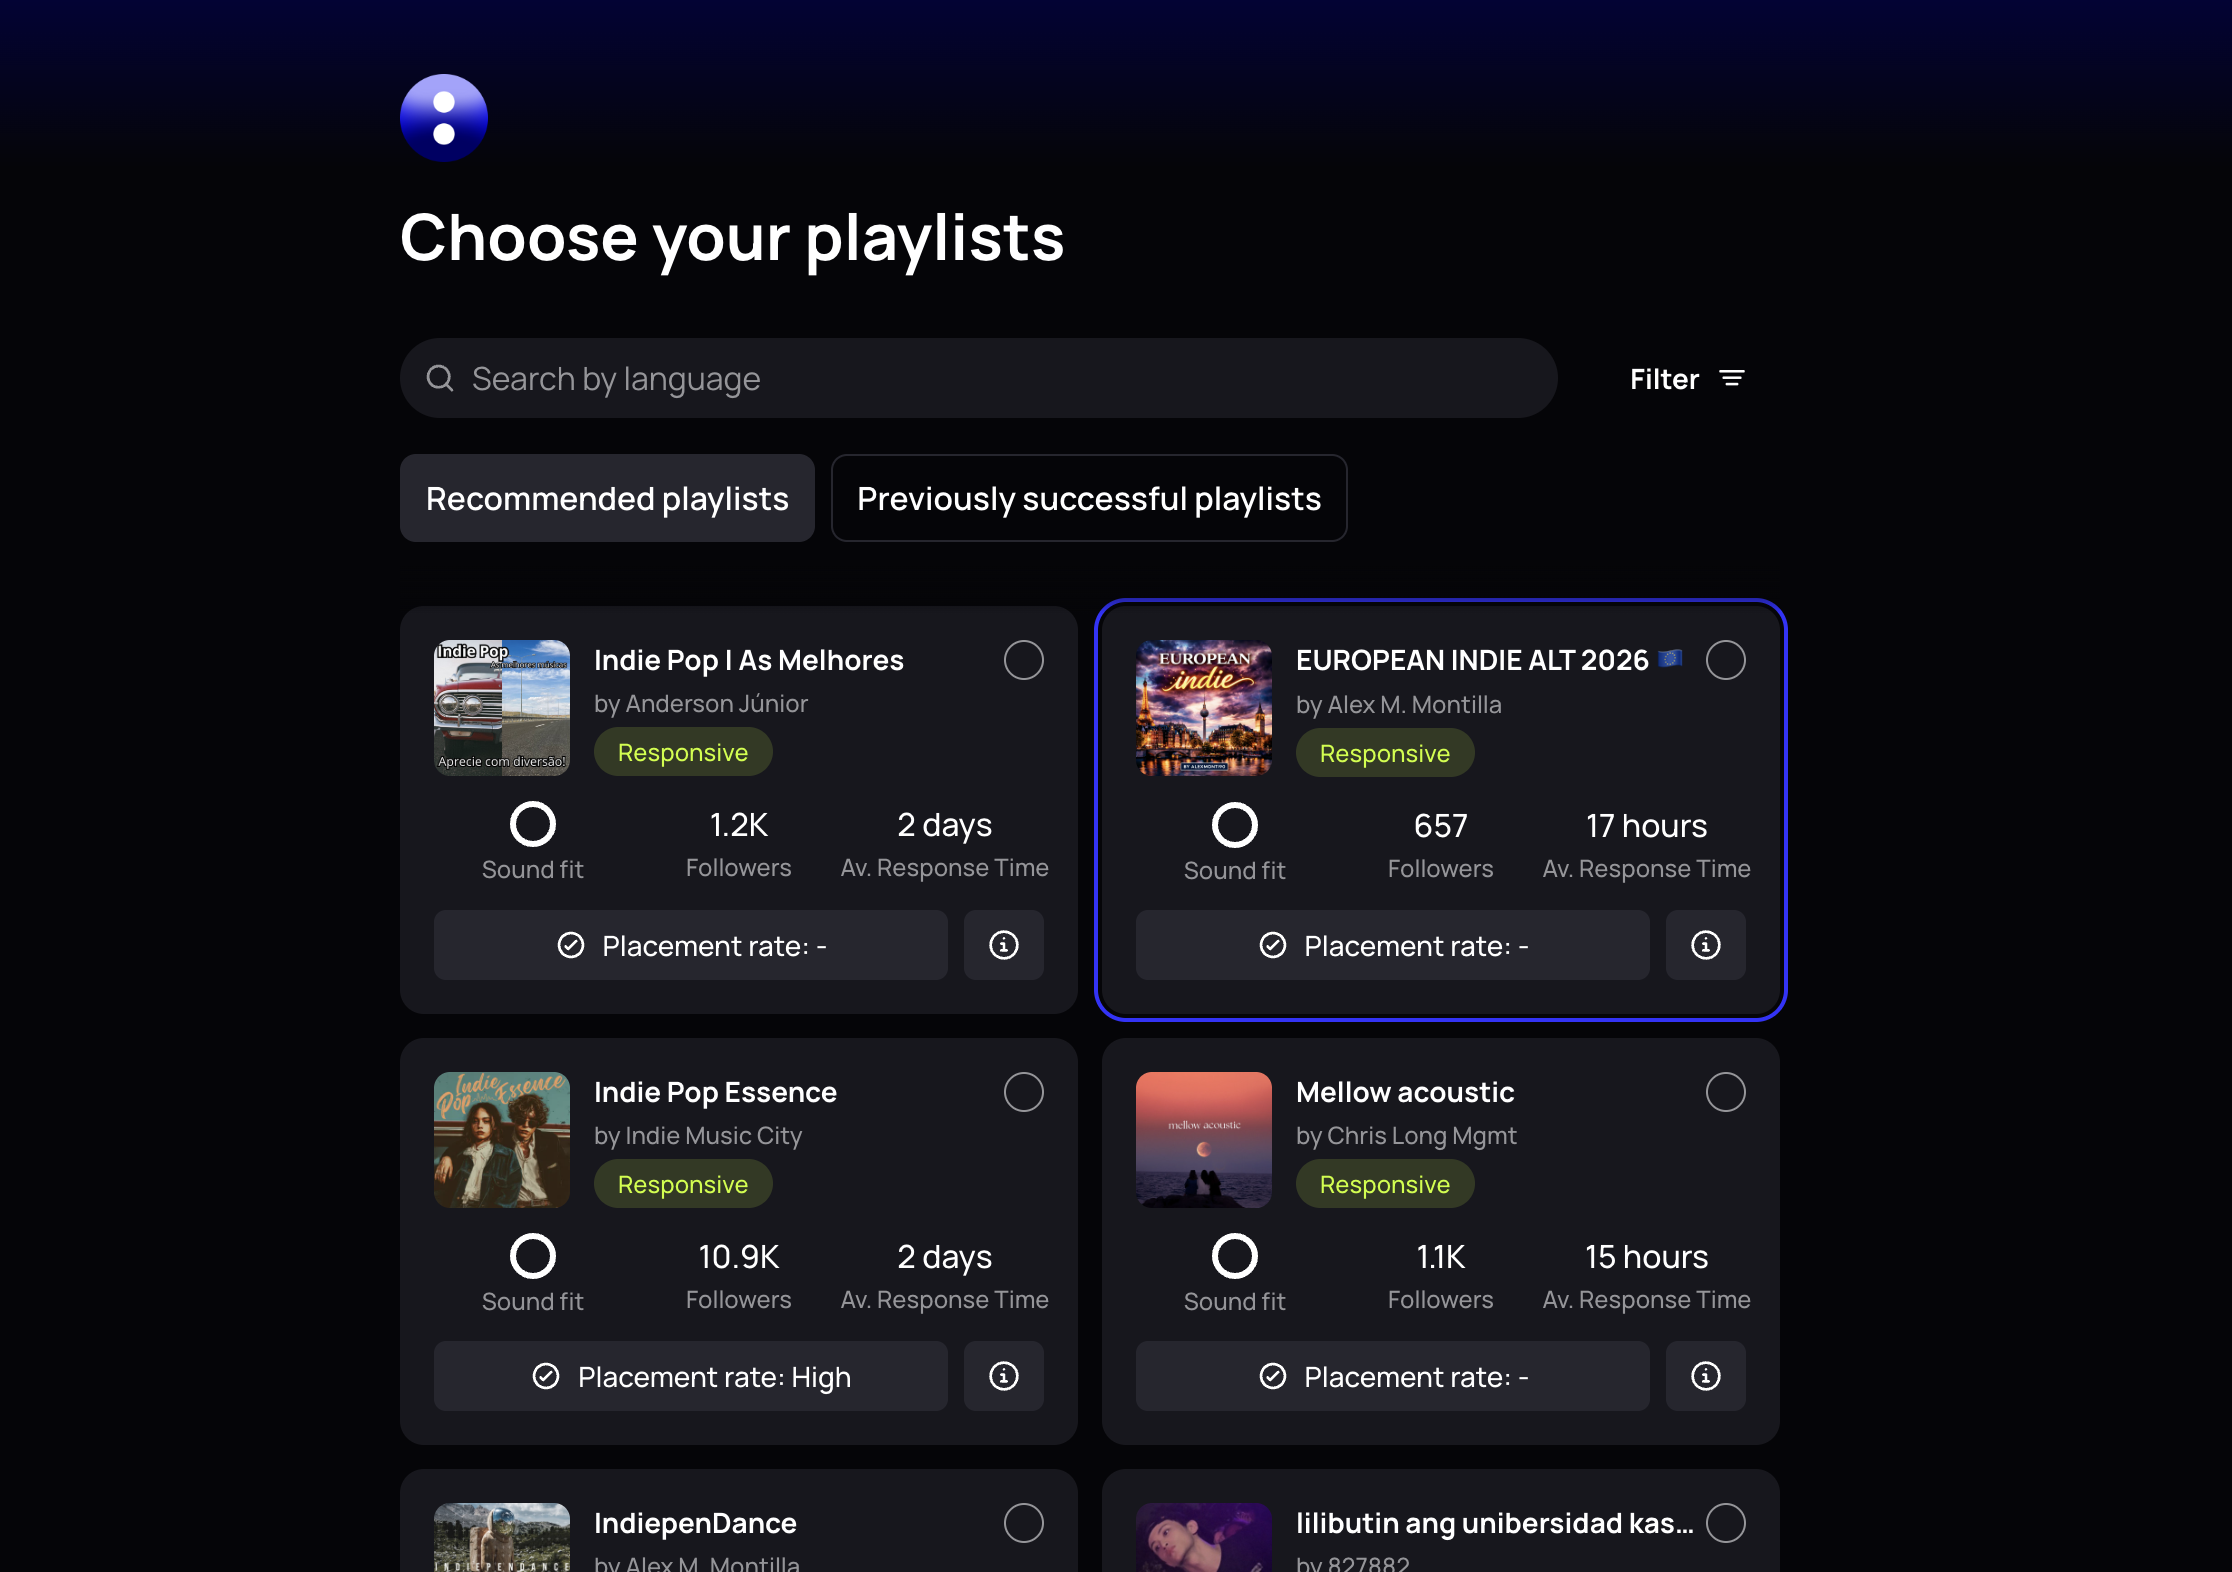
Judge a playlist placement by what listeners do after they hear you there. In the source of streams view, compare streams per listener on the playlist with your active sources. A playlist that brings lots of listeners with one or two plays each is giving you reach. If your active listeners and followers rise in the weeks after, the playlist is turning some of those listeners into fans.
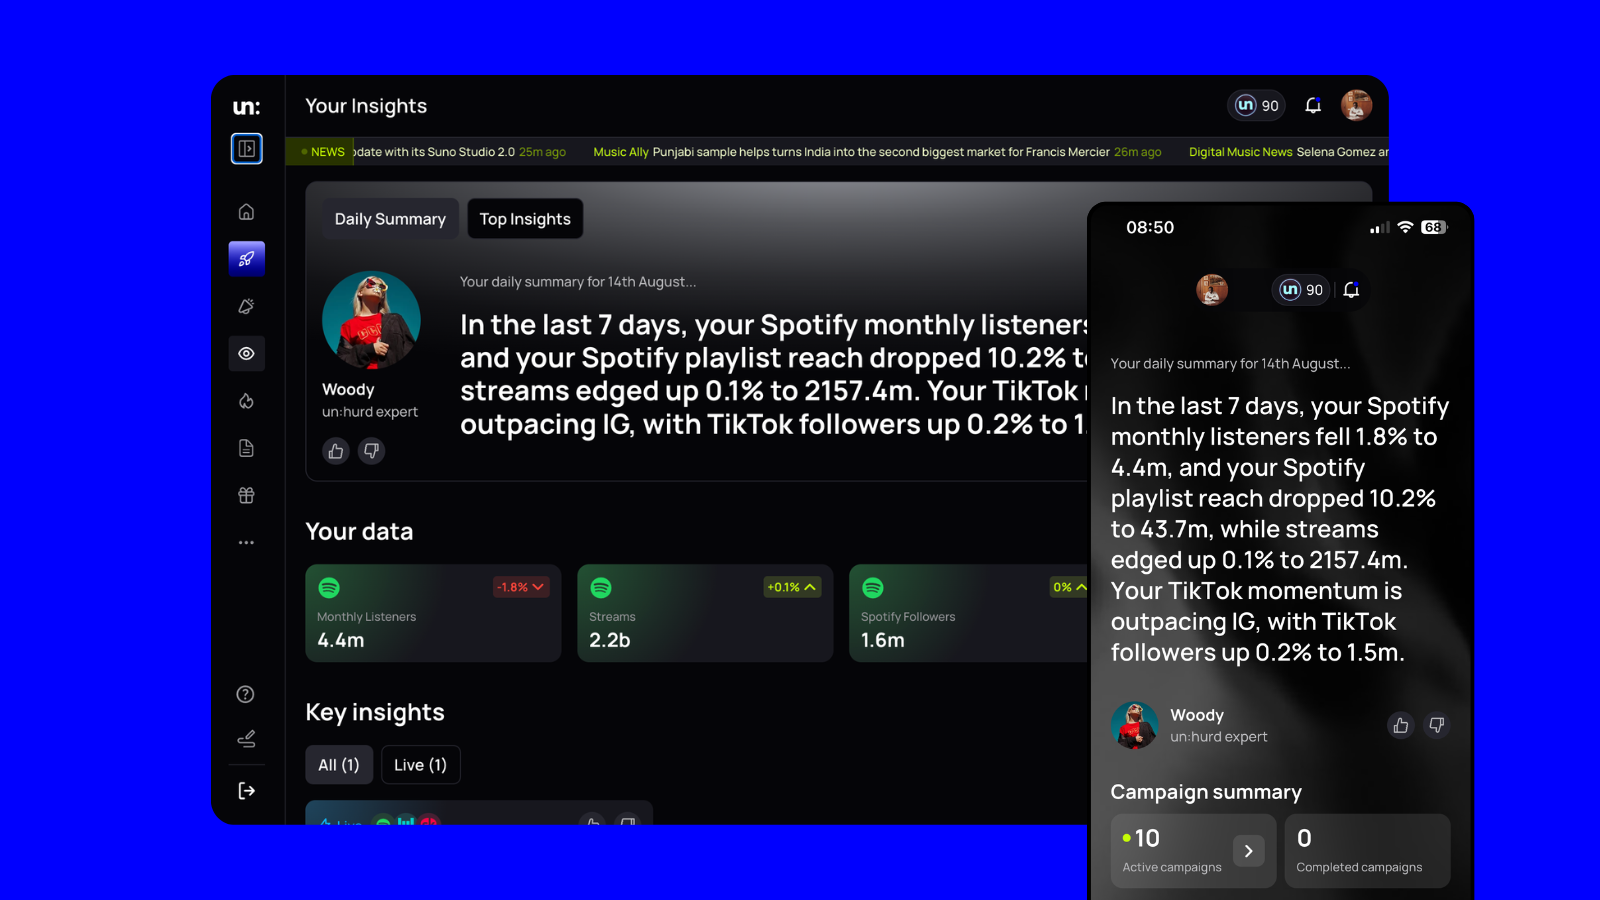
Streams per listener is worth tracking on its own. One un:hurd artist's dashboard showed 2.8 streams per listener, down 2.5%. A small dip like that is worth checking against the date a playlist add or an ad started, because a burst of new light listeners pulls the average down.
A tip that works with or without un:hurd: before you pitch or promote a song, note your monthly active listeners, followers and saves for that song. Check the same numbers four weeks later and you'll know what the campaign did beyond its stream count.
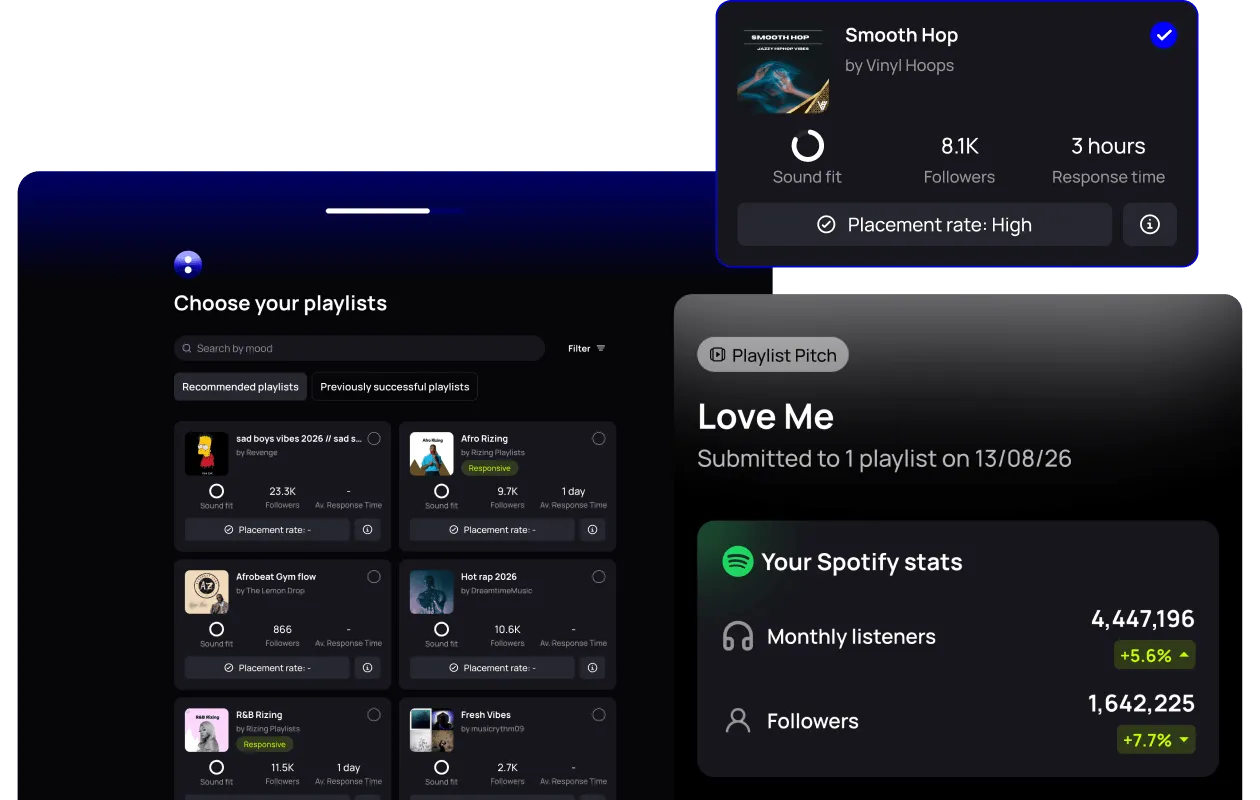
If you pitch through un:hurd, each playlist pitch campaign has a stats screen showing how your Spotify monthly listeners and followers change over the 4 weeks after the campaign starts. Monthly membership is £12.99 a month and includes one £6 playlist pitch each month. Our playlist pitching guide covers how to write a pitch that lands.
Turning your streaming data into a release plan
Each number above should lead to a decision about what you do next. Alex Brees, un:hurd's founder, describes the usual problem: "The biggest mistake is artists don't know what to do with their data or what they are looking for. So it causes confusion and people end up not doing anything in fear of making the wrong choice."
Smart Insights in un:hurd reads your streaming and social data together and gives you the next move in plain language. It counts fans per city across your connected platforms and flags when a city passes a milestone. Some of the insights it gives:
- When a track's Spotify Popularity score is above 15 and climbing, it suggests pitching the track to playlists.
- When your Shazams in 24 hours are more than three times the previous 24 hours, it suggests a geo-targeted ad in the city with the most Shazams.
- When your follower growth doubles in a week, it suggests a Creative Planning Cycle so new followers have a reason to stick around.
- When a city passes 500 fans, it suggests a Fan Hub page to collect emails there, so fans are ready when you announce a show.
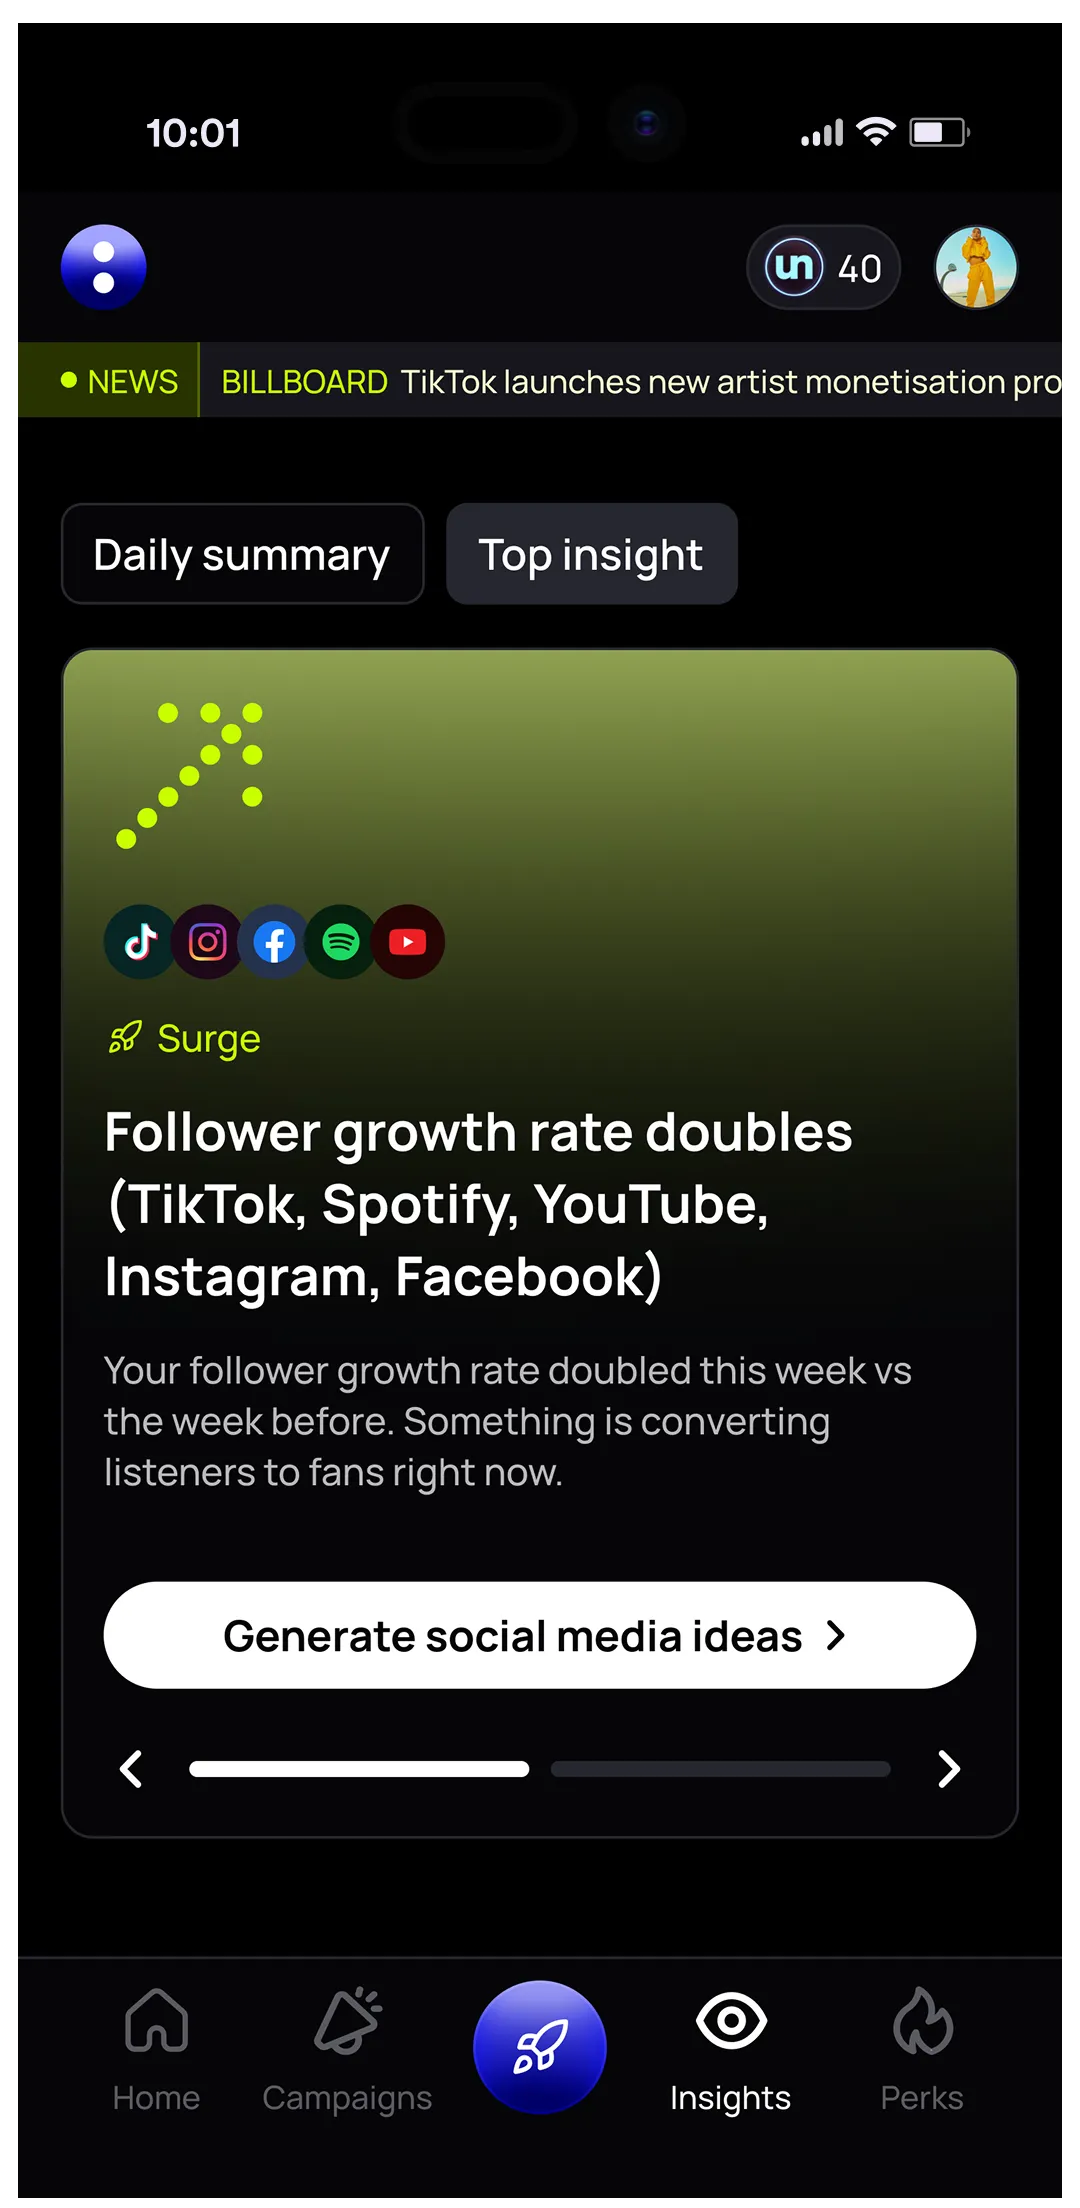
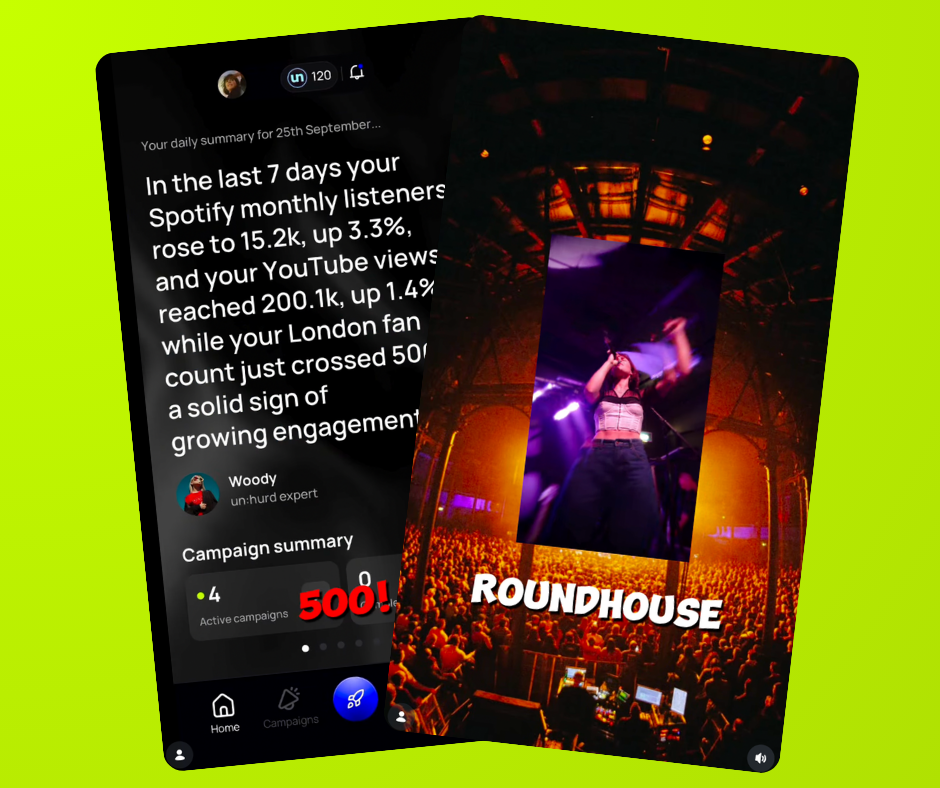
The daily summary sits alongside Smart Insights. It summarises your data and leads with your biggest highlights and opportunities, such as a jump in Shazams, which is a key early sign of momentum. Our Smart Insights guide shows both in more detail.
Katya is a good example of a city milestone in practice. Smart Insights flagged that her London fan count across her connected platforms had passed 500 and recommended a live show there. She's supporting Parra For Cuva at the Roundhouse in London on 17 October 2026 and using a Live Planning Cycle to build awareness for the show.
Planning Cycles build a marketing plan around your time and your goal, whether that's a release, live shows, content or the business side, and walk you through each task in order. Symphonic described it in a YouTube Short as taking some of the planning an artist manager usually does and putting it in your hands. Our guide to music release planning with Planning Cycles shows how a cycle is set up.
The short version
A growing fanbase is one where more people choose to play you and come back. In Spotify for Artists, track monthly active listeners rather than monthly listeners alone, watch your super and moderate segments grow, and keep an eye on new and reactivated listeners after each release. Judge launches and playlist placements on release engagement, saves, active sources and followers. Expect monthly listeners to swing with your release schedule, especially while your audience is small, and use what the numbers show to decide your next task.
If your numbers have moved since your last release, open un:hurd, check what Smart Insights is flagging and start a Planning Cycle built around it.
About the author
Sam Blackie is Head of Growth at un:hurd music.